Project Overview :
● Let's start by utilizing Python and the XlsxWriter package to make a clear and simple Excel file. XlsxWriter is a Python module for writing files in the Excel, in xlsx file format.
● Pandas is a Python library. Pandas is used to analyze data. Let's start by utilizing Python and the Pandas package to read the data from Excel file, pandas.
● read_excel() function is used to read excel sheet with extension .xlsx into pandas DataFrame. By default, it imports the first sheet from the excel file and parses the first row as a DataFrame column name.
● This is known as reading an excel sheet into a pandas dataFrame. Blynk was designed for the Internet of Things. It can control hardware remotely, it can display sensor data, it can store data, vizualize it.
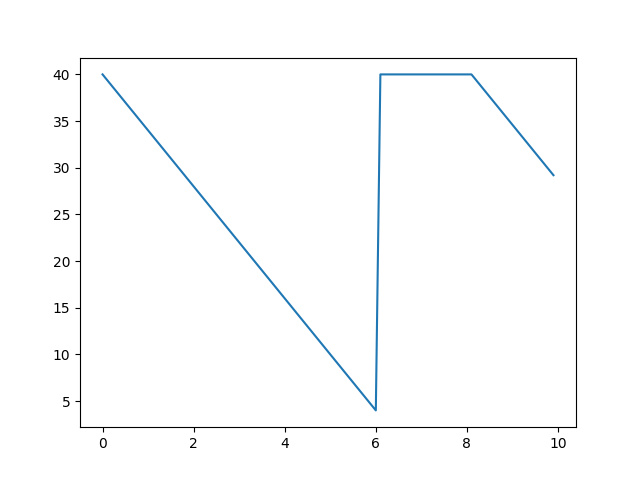
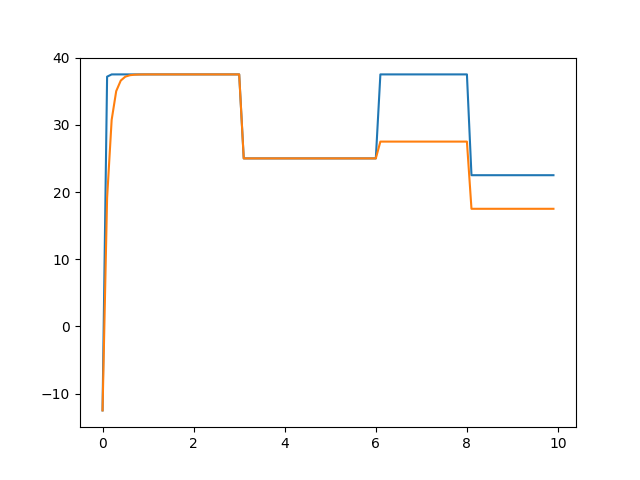
● Write details of fuel and velocities of car in excel file, read the data from excel and print it. Then display the data in gauge widget in blynk. Also plot the data using matplot.
Requirements :
● Python
● VS code
● Library –xlsxwriter, numpy,, matplotlib.pyplot and pandas requests
Code :
import xlsxwriter
import numpy as np
import matplotlib.pyplot as plt
import pandas
import requests
workbook = xlsxwriter.Workbook('Car_Data.xlsx')
worksheet = workbook.add_worksheet('DATA')
worksheet.write(0,0,"Fuel")
worksheet.write(0,1,"Velocity")
worksheet.write(0,2,"Velocity2")
Roll_no=50
a=40
b=40
for i in range(100):
  if i<=30:
    c=(0.75-np.exp(-5*i))*Roll_no
    d=(0.75-np.exp(-i))*Roll_no
    worksheet.write(i+1,0,a)
    worksheet.write(i+1,1,c)
    worksheet.write(i+1,2,d)
    a=a-0.6
  elif i>=30 and i<=60:
    c=(0.5-np.exp(-5*i))*Roll_no
    d=(0.5-np.exp(-i))*Roll_no
    worksheet.write(i+1,0,a)
    worksheet.write(i+1,1,c)
    worksheet.write(i+1,2,d)
    a=a-0.6
  elif i>=61 and i<=80:
    c=(0.75-np.exp(-5*i))*Roll_no
    d=(0.55-np.exp(-i))*Roll_no
    worksheet.write(i+1,0,b)
    worksheet.write(i+1,1,c)
    worksheet.write(i+1,2,d)
  elif i>=81 and i<=100:
    c=(0.45-np.exp(-5*i))*Roll_no
    d=(0.35-np.exp(-i))*Roll_no
    worksheet.write(i+1,0,b)
    worksheet.write(i+1,1,c)
    worksheet.write(i+1,2,d)
    b=b-0.6
workbook.close()
df = pandas.read_excel('Car_Data.xlsx')
Fuel=df['Fuel']
Velocity=df['Velocity']
Velocity2=df['Velocity2']
print(df)
Score=100
driver_score = Score
token='sMdrLut1gWZiyv8vEcQbPJM7FFrpsP-P'
for i in range(len(df)):
  drive_int = (Velocity[i]-Velocity2[i])
  if drive_int >=5 and drive_int<=30:
    driver_score= Score-drive_int
  print(i,Fuel[i],Velocity[i],Velocity2[i],driver_score)
  lnk_vol="https://blr1.blynk.cloud/external/api/update?token={}&V0={}".format(token,int(Fuel[i]))
  lnk_ct="https://blr1.blynk.cloud/external/api/update?token={}&V1={}".format(token,float(Velocity[i]))
  lnk_pow="https://blr1.blynk.cloud/external/api/update?token={}&V2={}".format(token,float(Velocity2[i]))
  lnk_ds="https://blr1.blynk.cloud/external/api/update?token={}&V3={}".format(token,float(driver_score))
  val_fl=requests.get(lnk_vol)
  val_ve=requests.get(lnk_ct)
  val_ve2=requests.get(lnk_pow)
  val_ds=requests.get(lnk_ds)
x=np.arange(0,10,0.1)
plt.plot(x, Fuel)
plt.show()
plt.plot(x, Velocity)
plt.plot(x, Velocity2)
plt.show()
Code Explanation :
● import xlsxwriter
● import numpy as np
● import matplotlib.pyplot as plt
● import pandas
● import requests
● Import all the required libraries.
● workbook = xlsxwriter.Workbook('Car_Data.xlsx')
● worksheet = workbook.add_worksheet('DATA')
● worksheet.write(0,0,"Fuel")
● worksheet.write(0,1,"Velocity")
● worksheet.write(0,2,"Velocity2")
Roll_no=50
a=40
b=40
for i in range(100):
if i<=30:
c=(0.75-np.exp(-5*i))*Roll_no
d=(0.75-np.exp(-i))*Roll_no
● worksheet.write(i+1,0,a)
● worksheet.write(i+1,1,c)
● worksheet.write(i+1,2,d)
a=a-0.6
elif i>=30 and i<=60:
c=(0.5-np.exp(-5*i))*Roll_no
d=(0.5-np.exp(-i))*Roll_no
● worksheet.write(i+1,0,a)
● worksheet.write(i+1,1,c)
● worksheet.write(i+1,2,d)
a=a-0.6
elif i>=61 and i<=80:
c=(0.75-np.exp(-5*i))*Roll_no
d=(0.55-np.exp(-i))*Roll_no
● worksheet.write(i+1,0,b)
● worksheet.write(i+1,1,c)
● worksheet.write(i+1,2,d)
elif i>=81 and i<=100:
c=(0.45-np.exp(-5*i))*Roll_no
d=(0.35-np.exp(-i))*Roll_no
● worksheet.write(i+1,0,b)
● worksheet.write(i+1,1,c)
● worksheet.write(i+1,2,d)
b=b-0.6
● workbook.close()
● Then write the data in excel using xlsxwriter named Car_Data.xlsx.
● df = pandas.read_excel('Car_Data.xlsx')
● Fuel=df['Fuel']
● Velocity=df['Velocity']
● Velocity2=df['Velocity2']
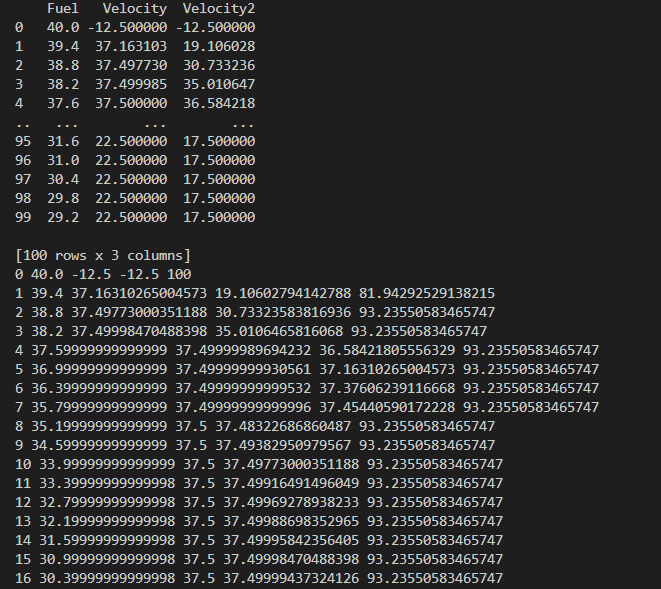
● print(df)
● Then read the data from Car_data.xlsx excel file which was already written and print the data.
● Score=100
● driver_score = Score
● token='sMdrLut1gWZiyv8vEcQbPJM7FFrpsP-P'
● for i in range(len(df)):
● drive_int = (Velocity[i]-Velocity2[i])
● if drive_int >=5 and drive_int<=30:
● driver_score= Score-drive_int
● print(i,Fuel[i],Velocity[i],Velocity2[i],driver_score)
● lnk_vol="https://blr1.blynk.cloud/external/api/update?token={}&V0={}".format(token,int(Fuel[i]))
● lnk_ct="https://blr1.blynk.cloud/external/api/update?token={}&V1={}".format(token,float(Velocity[i]))
● lnk_pow="https://blr1.blynk.cloud/external/api/update?token={}&V2={}".format(token,float(Velocity2[i]))
● lnk_ds="https://blr1.blynk.cloud/external/api/update?token={}&V3={}".format(token,float(driver_score))
● val_fl=requests.get(lnk_vol)
● val_ve=requests.get(lnk_ct)
● val_ve2=requests.get(lnk_pow)
● val_ds=requests.get(lnk_ds)
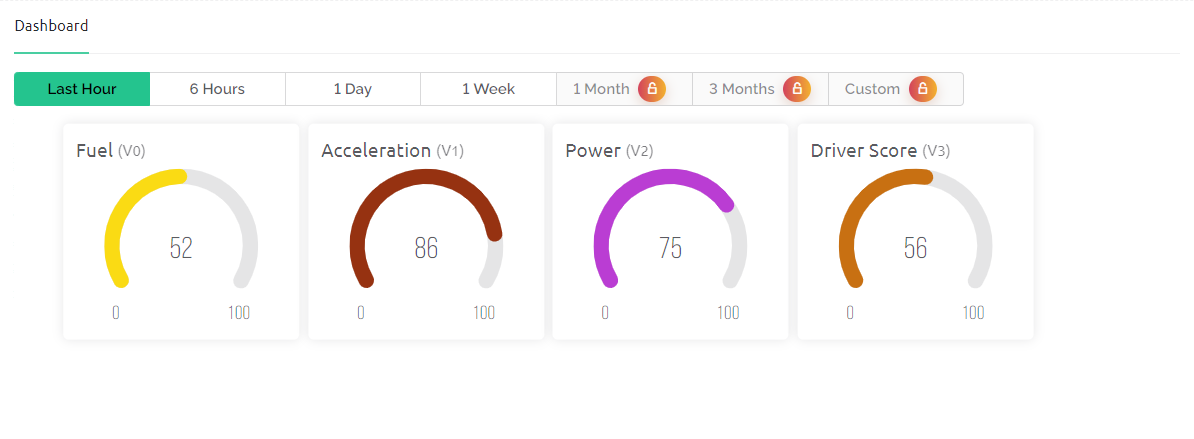
● Visualize and display the fuel, velocity, velocity2 and driver_score in gauge in blynk.
● x=np.arange(0,10,0.1)
● plt.plot(x, Fuel)
● plt.show()
● plt.plot(x, Velocity)
● plt.plot(x, Velocity2)
● plt.show()
● Also plot the fuel, velocity, and velocity2 in matplot.
● Run the code.
Output :
● After running the code, excel file was generated in the same folder and data was written using xlsxwriter,👉🏻 Click For Data File !!!
● Data read from the excel file using pandas read_excel() and it was print in the terminal.
● Dashboard was displayed in Blynk.
● Plot was generated for fuel, velocity, and velocity2