Project Overview :
● NumPy is an essential module for carrying out data science operations efficiently.
● NumPy stands for Numerical Python.
Matplotlib: Visualization with Python
● Matplotlib is a comprehensive library for creating static, animated, and interactive visualizations in Python. Matplotlib makes easy things easy and hard things possible. An object-oriented plotting library. A procedural interface is provided by the companion pyplot module, which may be imported directly. Eg: import matplotlib.pyplot as plt
Matplotlib Application Interfaces (APIs)
● Matplotlib has two major application interfaces, or styles of using the library:
● An explicit "Axes" interface that uses methods on a Figure or Axes object to create other Artists, and build a visualization step by step. This has also been called an "object-oriented" interface.
● An implicit "pyplot" interface that keeps track of the last Figure and Axes created, and adds Artists to the object it thinks the user wants.
Requirements :
● Python
● VS code
● Library – numpy
Code :
import numpy as np
import matplotlib.pyplot as plt

x = np.arange(0, 5*np.pi, 0.1)
y1 = np.sin(x)
y2 = np.cos(x)


plt.plot(x, y1, color="green")
plt.plot(x, y2, color="red")

plt.xlabel("x values from 0 to 5pi")
plt.ylabel("sin(x) and cos(x)")
plt.title("Plot of sin and cos from 0 to 5pi")
plt.legend(["sin(x)", "cos(x)"], loc='lower left', frameon=False)

plt.show()
Code Explanation :
● import numpy ->import numpy as np and use it in python. In command prompt or VS code terminal run the below pip command to install numpy library,
● pip3 install numpy # For Python version 3
● import matplotlib.pyplot as plt import matplotlib and use it in python. In command prompt or VS code terminal run the below pip command to install matplotlib library,
● pip3 install matplotlib
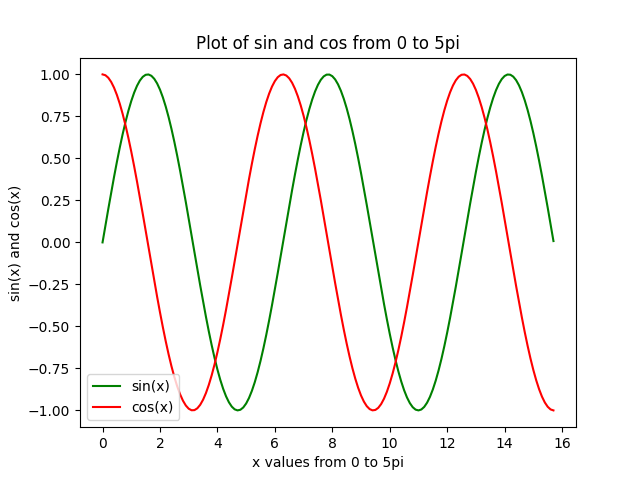
● Here pyplot() is the most important function in matplotlib library, which is used to plot 2D data. The following script plots the equation of sin wave and cos wave.
● arrange(), it creates an array by using the evenly spaced values over the given interval. The interval mentioned is half-opened i.e. [Start, Stop)
● arange([start,] stop [, step,][, dtype])
1. start : start of interval range, default starts at 0.
2. stop : end of interval range
3. step : [optional] step size of interval. By default, step size = 1,
4. dtype : type of output array
5. x = np.arange(0, 5*np.pi, 0.1) -> start at zero, stop at 5π and step by 0.1 radians.
6. y1 = np.sin(x) ->Sin wave as y1
7. y2 = np.cos(x) ->Cos wave as y2
● Set the graph:
● plt.plot(x, y1, color="green") -> Plot the sin wave in green color.
● plt.plot(x, y2, color="red") -> Plot the cos wave in red color.
● plt.xlabel("x values from 0 to 5pi") -> x axis label
● plt.ylabel("sin(x) and cos(x)") -> y axis label
● plt.title("Plot of sin and cos from 0 to 5pi") -> title of the graph
● plt.legend() command, which automatically creates a legend for any labelled plot elements, here we located the legend at 'lower left'. After fix the location and turn off the frame.
● plt.legend(["sin(x)", "cos(x)"], loc='lower left', frameon=False) plt.show() show the graph.
● Run the code.
Output :
●After running the code, output of the terminal as given below,